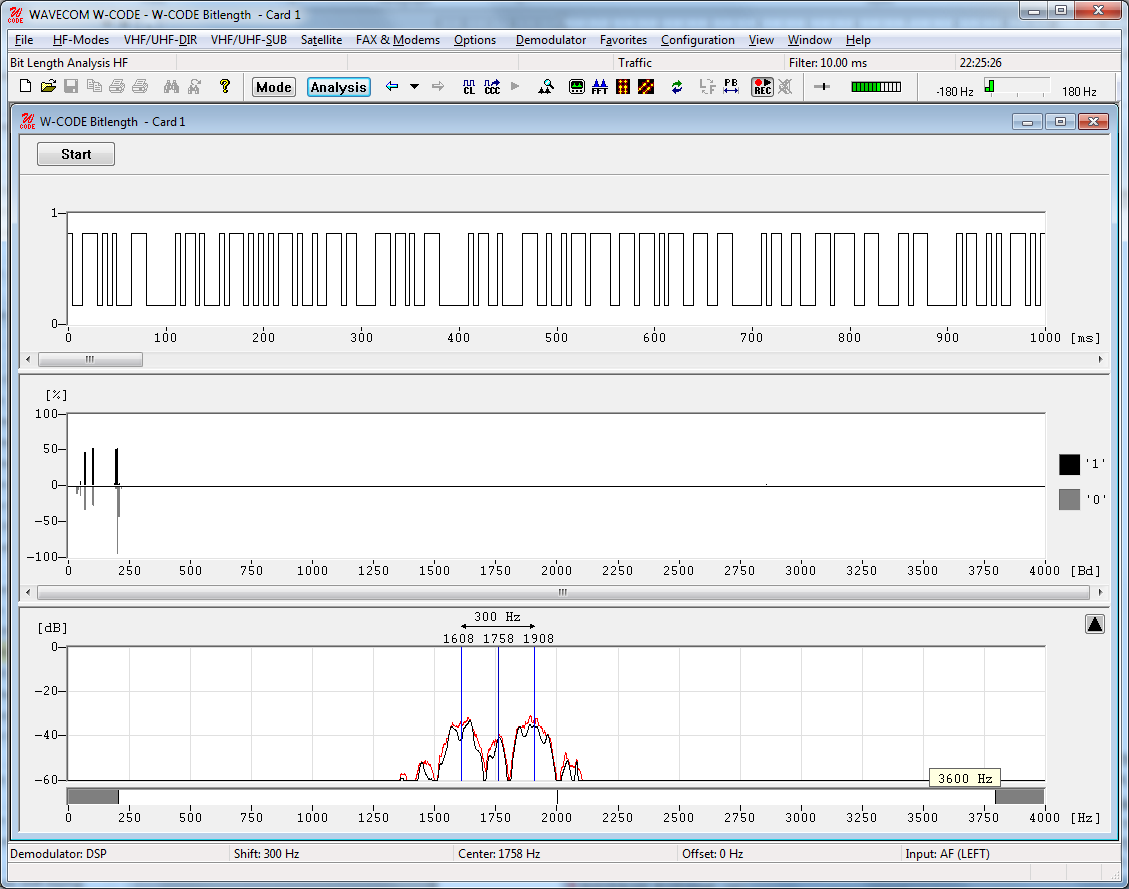
Bit length analysis serves to determine baud rate distributions, tone duration or bit length distributions.
The resolution offered by the sampler option is 14 μs (72,000 samples per second). After the demodulator has been correctly set up either manually or by using the auto function, sampling is initiated by pressing the Start button. To stop sampling, the Stop button is pressed. Captured data may then be further analyzed.
A screen with two graphs is displayed. The following example shows a typical bit length display screen.

The bit length analysis screen consists of a window for graphs of the two bit length distribution functions for binary 0 and 1, as well as a window containing a graph of the raw, binary data.
By right-clicking on one of the two displays a menu appears. By selecting Zoom In the mouse cursor changes its shape. By clicking and dragging, a field can be resized. After the zoom field has been sized, release the mouse button. An enlarged section of the raw data or the bit distribution is displayed. By selecting Zoom 100%, the full screen display will reappear.

Several color schemes are available through the right-click menu.
By clicking on the displays graphic cursors may be used to move over the graph to allow measurement of data.
The bottom window shows the distribution of bit lengths, as computed from the sampled data.
It should be noted that reception in the HF band may be subject to distortions. In such cases the distributions for the "0" and "1" values should be averaged.
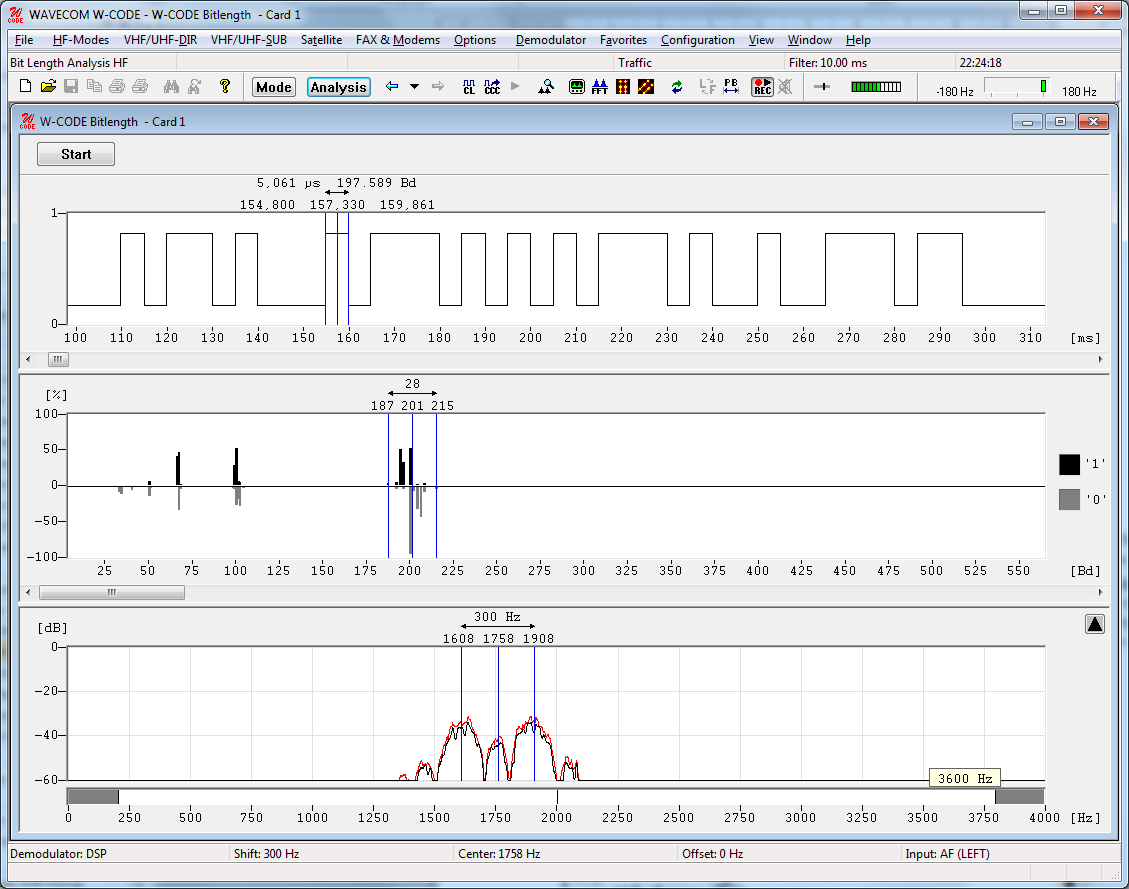
In the top window a graphical representation of the binary data "0" and "1" is provided. The resolution may be set using the zoom function. Practical values are between 1000 μs and 10000 μs. In general, the resolution is controlled by the smallest parameter to be measured. For MFSK, this corresponds to tone changes and RTTY to data transitions (bits).
Using the scroll bar the binary bit pattern may be continuously moved left or right. This allows easy location of the bit/tone duration to be measured.
The example shows the lower section of the screen display after using the zoom function. The cursors may be moved across the bit pattern. The individual positions of the cursors, as well as the difference between the two cursors, are continuously displayed in μs and Bd.
When measuring binary 0s or 1s (mark or space) it should be noted that the two levels may be subject to severe distortions, depending on the quality of the received signal. Using the average value over a number of measurements improves the accuracy of results. Some transmission modes are modulated in terms of bit length or bit position (Pulse Width and Pulse Position Modulation).