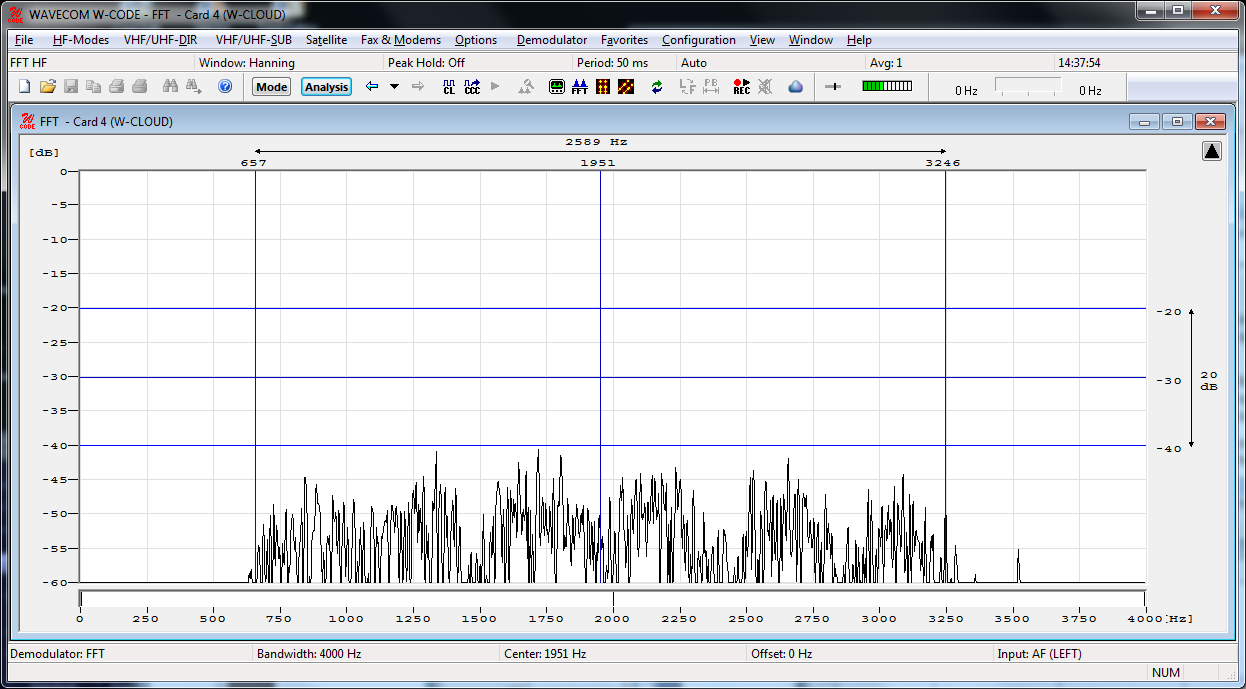
The real-time FFT analysis is a powerful spectrum analysis tool based on Fast Fourier Analysis (FFT), operating in real time with a 4096-point resolution. The signal is digitized, saved and its frequency spectrum calculated and displayed.
The measurement is started by selecting a bandwidth. The display of the frequency spectrum has a linear scale and covers a dynamic range of 60 dB. (The internal dynamic range is considerably higher due to the 16 bit A/D converter used, but the configured display resolution performs better in practical use.)
The frame refresh rate averages 10 to 20 pictures per second, allowing even fast signal changes to be displayed. The frame refresh rate is however dependent on the speed of the PC and its video card.
To start the FFT, click on the FFT button or use Analysis | Real-time FFT from one of the menus.
To activate the measurement cursors, click inside the FFT graphics window. The left and right cursors may be moved around using the mouse. The cursor positions are displayed as absolute frequency values; the center cursor automatically displays the center value.
To remove the cursors, click on the graphics window again.
When the cursors have been placed in the desired positions they may be moved right or left by moving the center cursor. By doing this, the measurement of frequency spacing in MFSK and FDM systems is possible.
A “Spectrum Analysis” tool can be switched on using “Option -> Spectrum Analysis”. This tool will detect available signals in the analysis (display) bandwidth. All signals will be displayed with their important parameters (Center and Bandwidth).
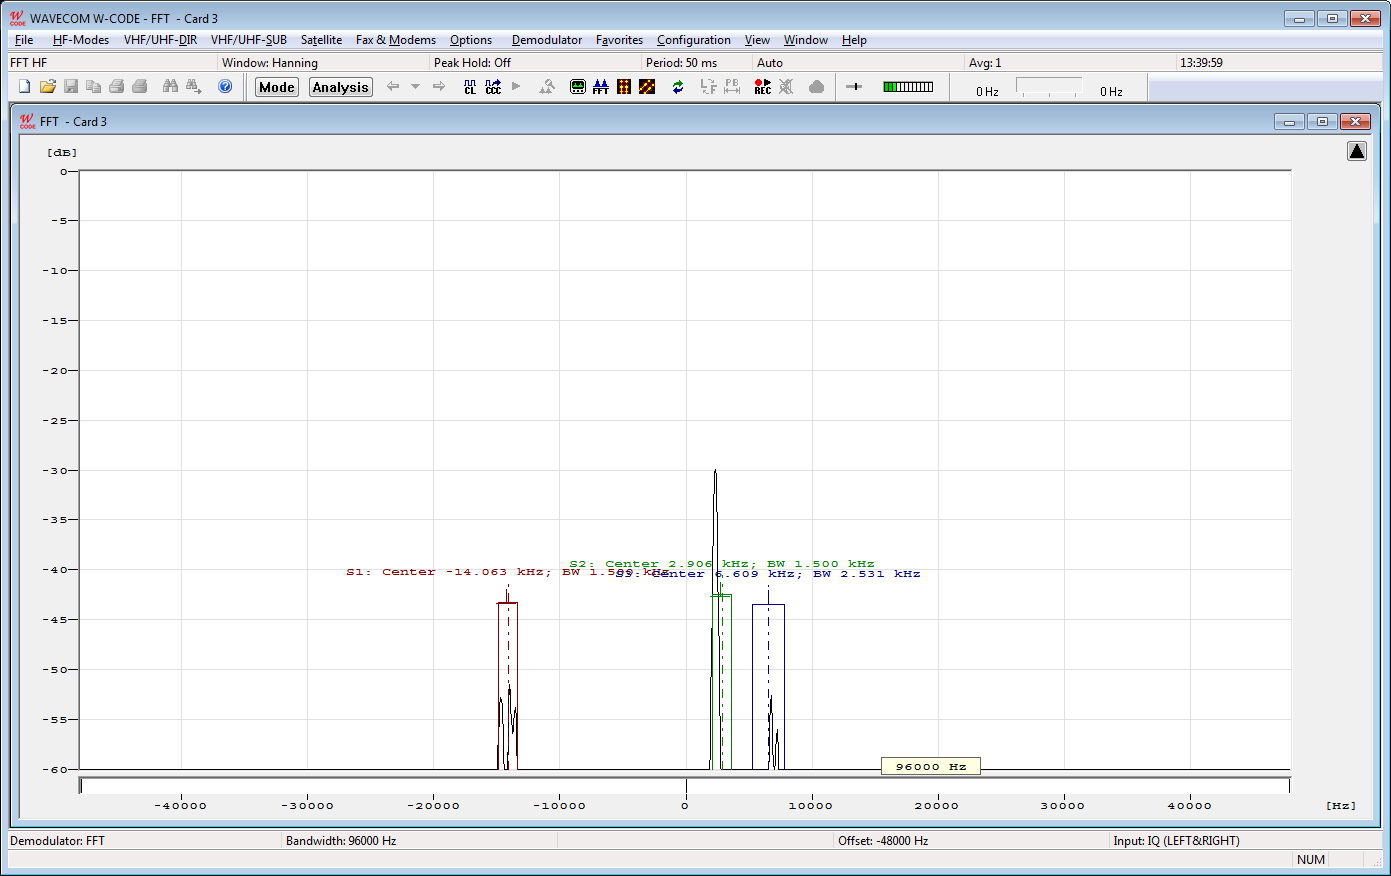
As in the above example, 3 signals are detected in the 96 kHz display bandwidth. In every signal certain sub-signals are detected as well.
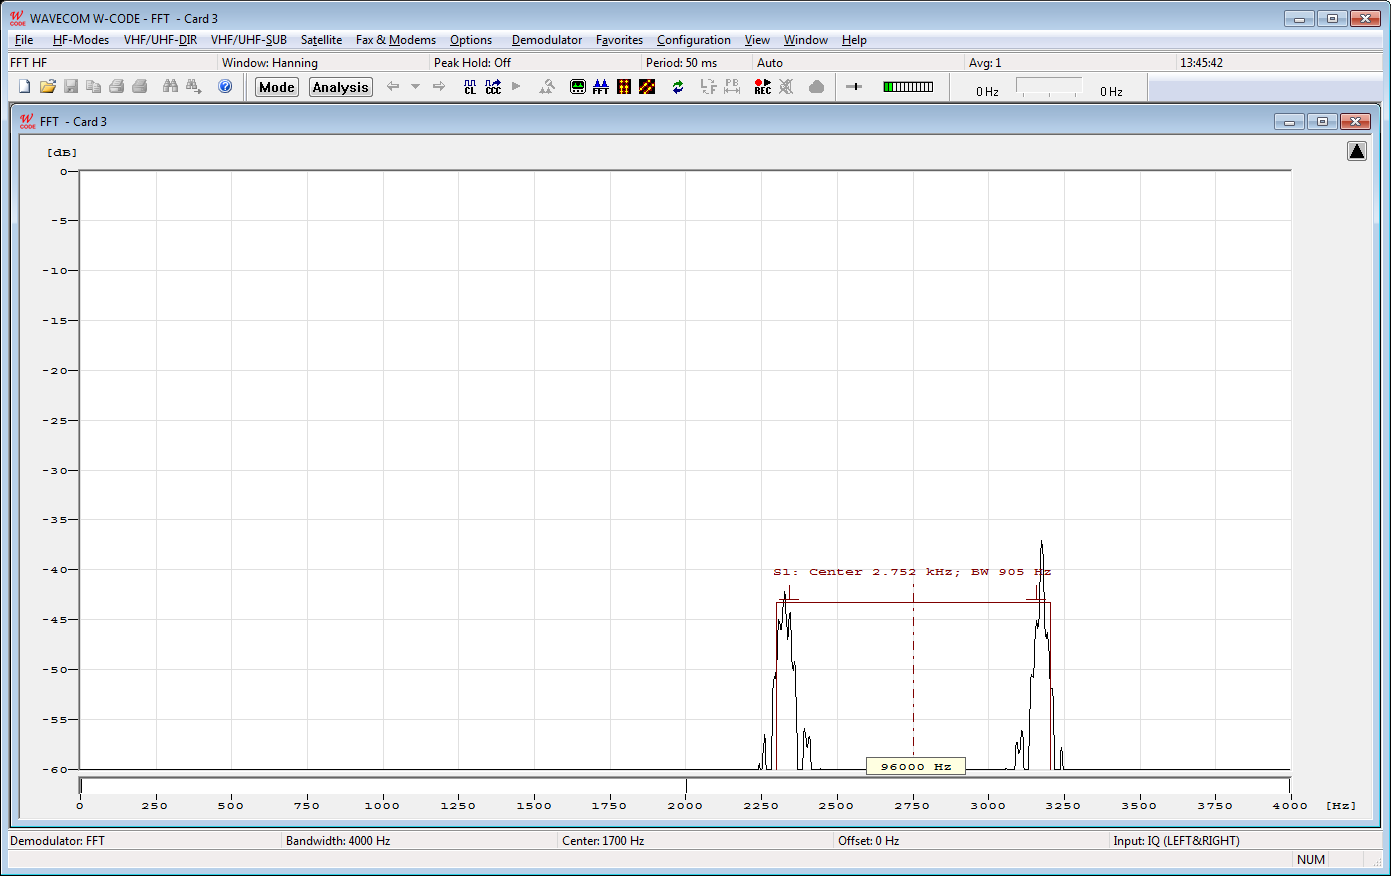
For example, in an FSK signal, 2 sub-signals are detected and marked.
The whole spectrum analysis result (all detected signals with their sub-signals) can be saved in an XML file (File -> Save As Text) with the time-stamp. All result will be delivered on the XML remote control interface instantaneously for third-party analysis.
Adjustment of the Offset Frequency
An FFT spectrum calculation can be done from 0 Hz, up to the selected maximum frequency (bandwidth).
The offset frequency for decoding of VHF/UHF-DIR transmissions e.g., POCSAG, GOLAY/GSC, or ERMES must be adjusted to the effective center frequency of the signal, e.g., 455 kHz.
A bandwidth of 24 kHz from 455 kHz to 479 kHz is sufficient for the measurement range of the FFT. therefore the offset frequency must be offset to half of the bandwidth. The offset frequency adjustment is calculated as the IF output frequency (455 kHz) minus half of the selected FFT bandwidth (24/2 kHz) = Offset (443 kHz). The measurement range is now 443 kHz - 467 kHz.
For the 455 kHz receiver IF output of a shortwave receiver (e.g., HF-1000), the offset frequency is first adjusted to 453.3 kHz to obtain the standard center frequency of 1,700 Hz. The HF-1000 BFO must now be adjusted to 1,700 Hz.