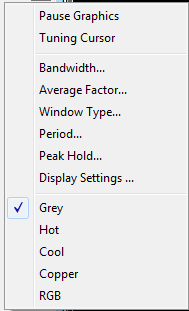
Pause Graphic
Freeze the FFT or Sonagram Window.
Tuning Cursor
Show the 8 green cursor-group in the FFT or Sonagram Window for tuning (multi-carrier) signals.
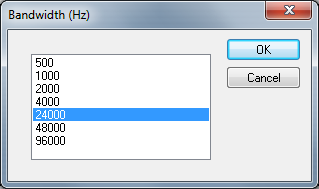
Bandwidth...
To select a display bandwidth use Bandwidth from the context menu or double-click on the Bandwidth: field on the demodulator status bar. For the Tuning Sonagram / FFT bandwidths of 0.5, 1.0, 2.0, and 4.0 kHz are available. For the Analysis FFT/Sonagram bandwidths of 0.5, 1.0, 2.0, 4.0, 24, 48 and 96 kHz are available.
Average Factor
After choosing an Average Factor from the context menu, the average of up to 64 measurements may be displayed at each step. A value of "1" turns averaging off. The averaged display of several measurements is very helpful when monitoring MFSK and FDM transmissions or during heavy fading. The averaging function may also be selected by double-clicking the Avg: field in the upper status bar.
Window Type…
Four window functions Rectangle, Hamming, Hanning and Blackman may be selected. The selection of a window type influences the accuracy of the signal spectrum measurement. Good frequency resolution is obtained using the rectangular window, however the rectangular window also causes heavy distortion due to its poor side-lobe suppression characteristics. A window should be chosen according to the user’s requirements; each window type has its own characteristics as listed below.
The user should be aware that changes in the received signal can cause the display of spurious spectral lines or aliasing ("false" frequency display) in FFT measurements. Depending on the keying frequency and the magnitude of the frequency shift, the aliased frequencies may even be stronger than the desired signal.
|
Window Type |
Signal Type |
Frequency Resolution |
Spectral Leakage |
Amplitude Accuracy |
|
Blackman |
Random |
Poor |
Best |
Poor |
|
Hamming |
Random |
Good |
Fair |
Fair |
|
Hanning |
Random |
Good |
Good |
Fair |
|
Rectangular |
Transient |
Best |
Poor |
Poor |
Period...
From the Period menu the time unit per measurement may be selected. The lowest value is 50 ms corresponding to 20 FFT’s/s. For the highest value of 10,000 ms a measurement is done once every 10 seconds.
Peak Hold…
For easy tuning, switch on Peak Hold in the Options menu on. The tone spectrum appears in the FFT window after a short delay and the frequency range can be changed as required using the cursors as shown below.
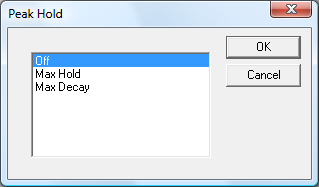
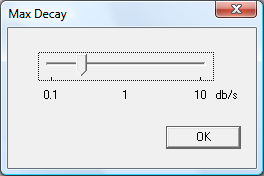
If you select max Decay, then a decay value can be set. This allows to use the peak hold functions during thunderstorms or if tuning the receiver.
Display Settings…
To configure other parameters of the FFT, select Display Settings.
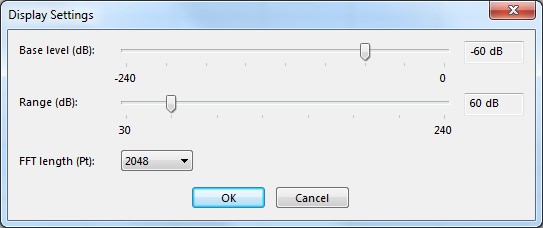
The sliders "Base level" and "Range" control the dynamics of the FFT. "Base level" sets the minimum level that is visible in the FFT display. "Range" is the difference between the maximum and the minimum level.
With "FFT length", the number of points used to calculate the FFT can be set. A longer FFT length leads to increased resolution in the frequency domain. This can be useful in analyzing OFDM signals, where it is also recommended to select a bigger average factor to reduce the noise shown in the FFT.
Color Schemes
Select between Grey, Hot, Cool, Cooper and RGB.