FSK Analysis Options
To assist in the measurement of noisy signals, a peak
measurement function and an averaging function are available. When one of these
options is selected the last five samples will be used for calculations. The
result is displayed in the graph window. The user may also select a larger time
span as basis for calculations from anywhere in the waterfall window.
Measure Peak and Average Values
Select the function you wish to use from the Options
menu. A checkmark is shown to the left of the selected and
five samples are inverted in the waterfall window selected to indicate the
number of samples used for the calculations.
If you wish to use a different number of samples in the
calculation, place the mouse on the waterfall sample from which calculation
should start, and hold and drag the mouse over as many samples as you want to
use.
The marked samples will be color inverted, cursors will
appear in the graph window and the graph display will show the average or peak
value of the marked samples.
To peak or average measurement,
uncheck it in the Options menu: the cursors will disappear, only one
sample is marked in the waterfall window, and updating of the graph window will
resume.
Examine Sample, Display Cursors
Click on the baudrate or the spectrum graph window to
display the cursors, or click on the sample in the waterfall window that you
wish to examine. Graph window updates will stop and a pair of cursors will
appear. You may move the cursors along the x-axis in normal fashion. The
matching waterfall sample is marked with the time cursor.
Click on the graph window again to remove the cursors and
resume graph window updates.
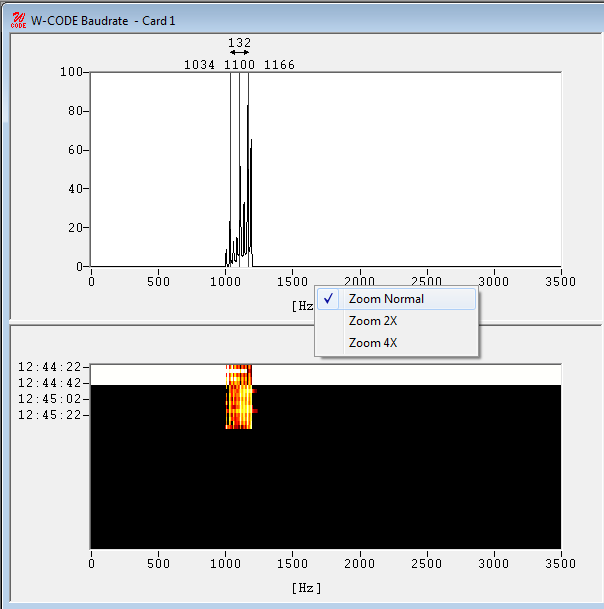
Zoom
|
Right-click with the mouse into the spectrum or
baudrate graph pane (upper panes) and select if you like to Zoom 2X
or or to Zoom 4X.
|
|
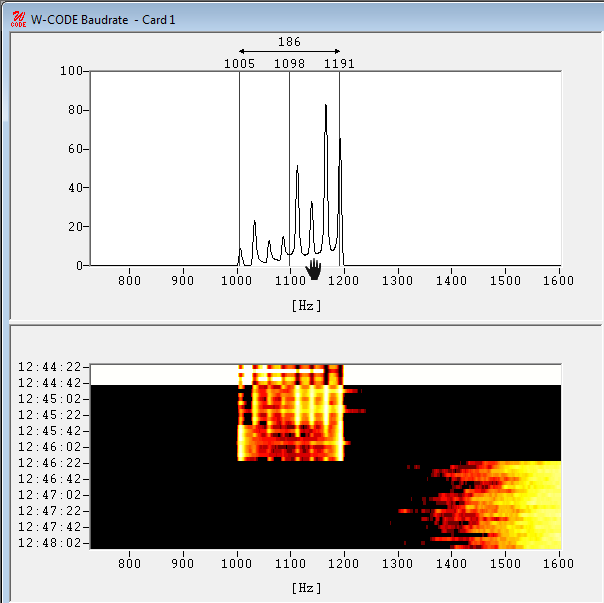
To adjust the frequency scale, move the cursor into
the range of the frequency scale. If you see the “Hand”, press the left
mouse button and move the frequency slider.
|
|