The MFSK analysis for the HF signal range employs a graphical display in two dimensions, frequency (y-axis) and time (x-axis). Both values may be preset. This tool was originally developed for the analysis of analogue tone call systems, but is equally suitable for evaluation of FSK and MFSK systems. In particular the frequency and element duration is well displayed.
After starting MFSK Analysis the detected frequency values are displayed as pixels.
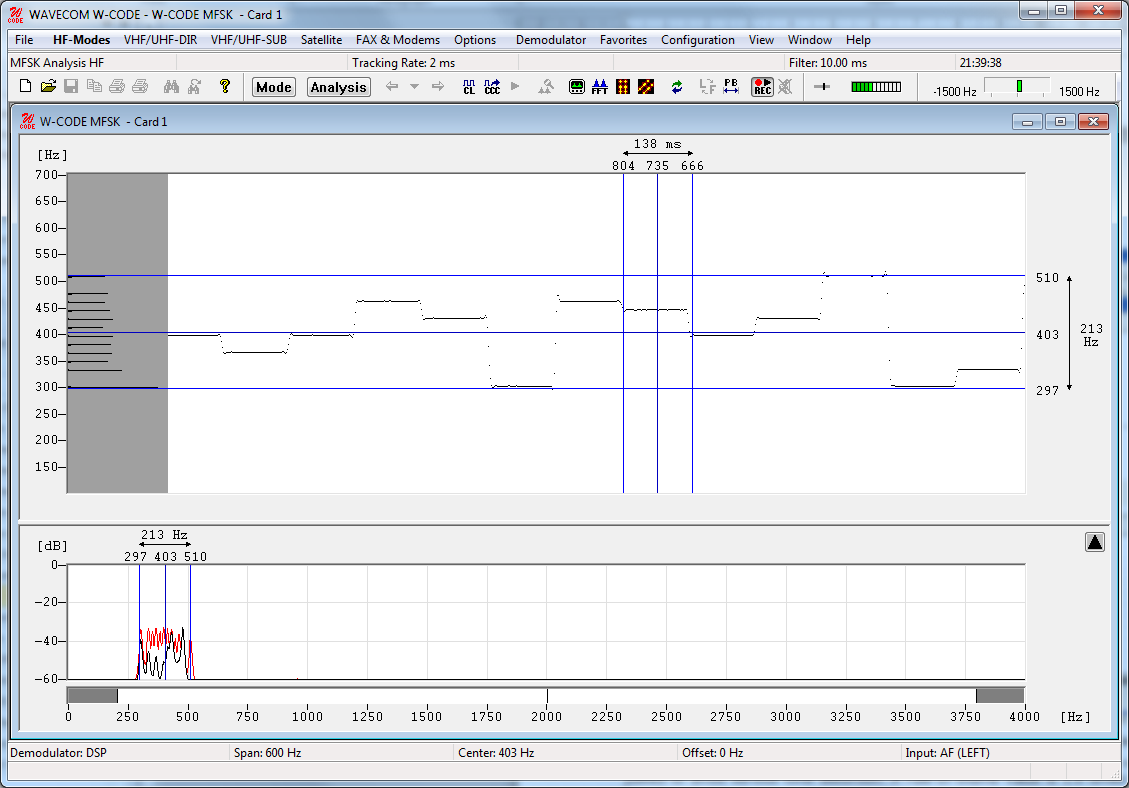
A monitored MFSK signal is easily recognized as stable lines. To stop the display from scrolling horizontally, click on the display. Measurement cursors for both the time axis and the frequency axis appear. The display may be scrolled backwards, with a maximum range of 15 seconds when tracking rate is set to 1 ms, and 225 seconds when the tracking rate is set to 15ms. The scroll-back range for all tracking rate settings in between varies accordingly.
Tracking rate determines the sampling rate. The range is 1 - 15 ms; the default is 2 ms.
Double-clicking Filter inserts a low pass filter for filtering the tones. The value of the filter should be adjusted to avoid serious tone distortion. A rule-of-thumb value is 1.6 times the baud rate.
The filter range is 1 - 100 ms.
Using the Span menu, the resolution of the frequency axis may be increased. The steps are 3000 Hz (for analogue selective calling systems), 1500, 600 and 300 Hz.
From the Center menu, the center frequency may be adjusted. It is important to readjust the center frequency whenever the frequency (Span) axis is increased.
Several Color schemes are available through the right-click menu.