The FSK analysis mode is an important tool to measure the baud rate and frequency shift of FSK transmissions. The magnitude of these property values may help to identify the transmission being monitored.
To open the FSK analysis window go to the HF-Modes menu and select Analysis/FSK Analysis, or use the FSK Analysis button. The baud rate and spectrum window will open, but NOT the waterfall window. After a few seconds the baud rate and spectrum window are updated.
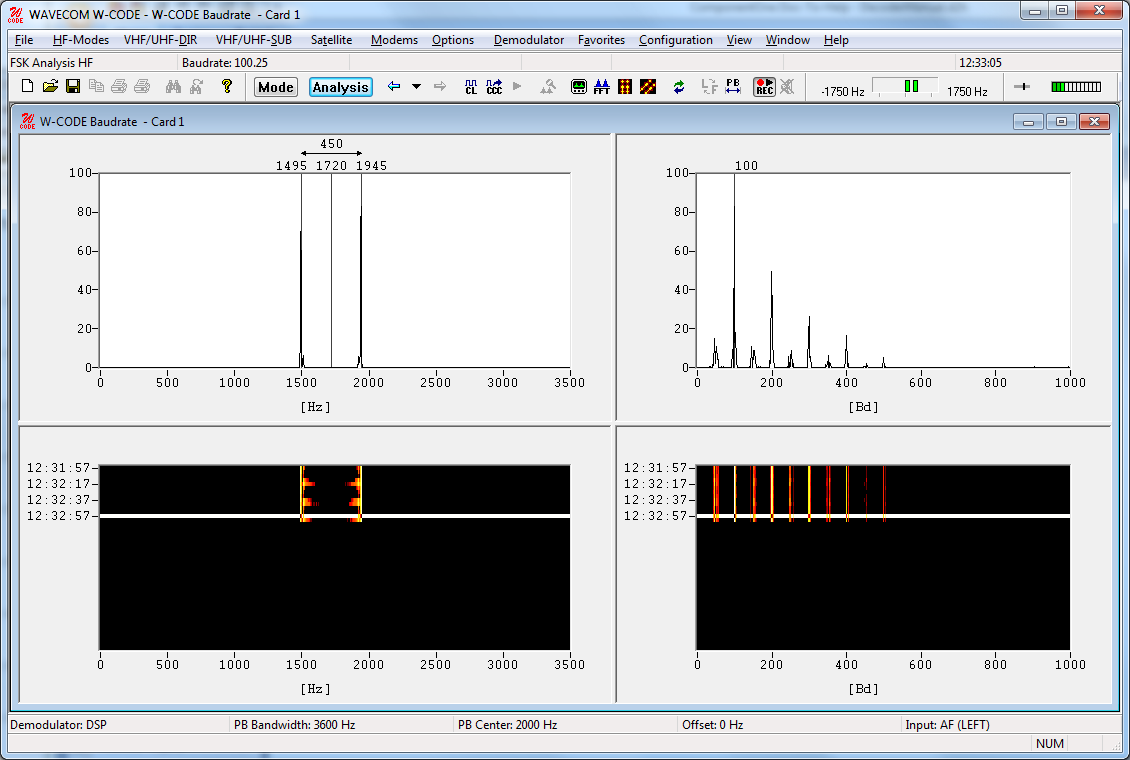
The FSK analysis window consists of four panes:
Ø A spectrum graph pane
Ø A spectrum waterfall pane
Ø A baudrate graph pane
Ø A baudrate waterfall pane
Baudrate and Spectrum Window
The baudrate and spectrum window are two-dimensional displays of the monitored baud rate, measured in Baud, and the spectrum of the transmission, measured in Hz, on a relative scale from 0 to 100. The displays are updated around every 5 seconds. The calculated baud rate, center frequency and frequency shift values of the latest sample are stored to be used whenever a decoding mode is selected.
Two pairs of cursors may be placed in the baudrate and spectrum graph windows, to assist in manual measurements. The values to which they point, and the difference between the two cursor values, are shown above the cursors. When a pair of cursors is placed in one of these windows, graph display updating is halted, but signal sampling continues and is displayed in the waterfall window. The time cursor in the waterfall window is placed on the selected sample.
Methods exclusively based on bit length measurement are unreliable for baud rate measurements. The baud rate measuring process employed by the decoder is therefore based on a new method employing auto-correlation and subsequent Fast Fourier Transformation (FFT) presentation. Using this method, FSK transmissions may be analyzed without problems. Be aware that when measuring the baud rate of codes using code words which have a non-integer number of bits, e.g., asynchronous 7.5-bit ITA-2, the indicated baud rate will increase by a factor two.
Waterfall Window
To open the waterfall window, move the mouse to the left of the extreme right of the graph window. The normal cursor will turn into a splitter - two parallel lines with arrows perpendicularly attached. Now, hold and drag to place the boundary between the windows where you wish, when the mouse button is released.
The waterfall windows are two-dimensional displays of baud rate and spectrum versus time. The color intensity of the displays represents the energy density of the spectrum, and the value of the relative occurrence of a baud rate - for gray scale values, white is the highest intensity and black the lowest. A time stamp points to the latest sample taken. The latest sample is color inverted to distinguish it from the previous samples.
If the user wishes to examine a particular sample, it may be selected in the waterfall window. The sample is marked with the time cursor, cursors are placed in the graph window and updating is halted in that window.