A second widespread method for FFT display is the real-time sonagram, which displays the amplitude and frequency values produced by the FFT over time. In the sonagram, the signal amplitude is displayed by colour, with different colours representing different amplitudes. Sometimes this display is also called “Spectrogram”.
This amplitude related spectrum analysis mode offers many hints to the distribution of a signal spectrum.
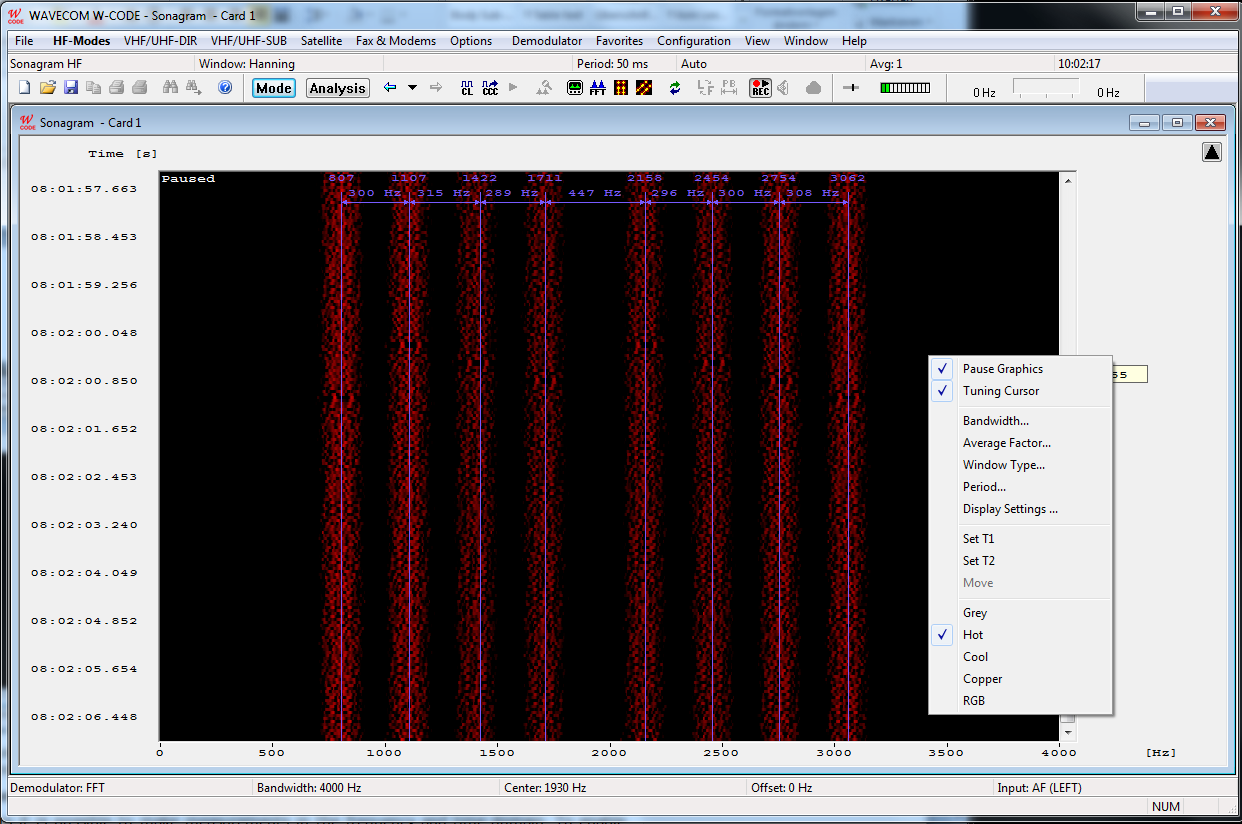
The operation is numerically identical to the real-time waterfall analysis, and is simply a different method of visualisation.
Options can be set using the right mouse button or the context menu (see FFT/Sonagram Context Menu). It is possible to remove the tuning FFT or Sonagram in the View Menu.
Making measurements
With the four cursors it is possible to make measurements in the frequency and time domain. To enable the time cursors, click into the sonagram to freeze the screen. Then click with the right mouse button to get the menu to set the time cursors.
Ø T1 Add first cursor to the actual mouse position
Ø T2 Add second cursor to the actual mouse position
Ø Move Move T1 cursor and T2 cursor simultaneously
It is also possible to drag the cursor to a new location. If the cursor line gets in the upper our lower part of the window, then the window will scroll automatically.